Read the book: «The journey of a Cryptocurrency Trader. Trading on futures markets», page 3
A trading setup is just one of the components responsible for the overall result. Again, a sports analogy. Think of a gifted athlete, will they achieve high results if they do not follow the regime and spend their nights scrolling on the phone instead of going to bed on time and resting? The same is true for a trader. Suppose there's a more active, volatile time and a well-formed scalper trading setup. But the volume filters we use in the office indicate there is no liquidity in the instrument – there is no money in it. And no matter how nice your setup is, you are most likely going to take a loss there. And this is where discipline comes into play: don't go into a configuration that is not yours, don't go into an illiquid instrument.
(Vladimir, 30 years old, eight years of experience)
Training with M gave Arseniy general knowledge of technical analysis and a more complete understanding of the work of a trader. His trading became more conscious, and he gradually gained experience, including negative one.
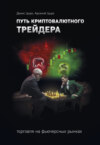
The year 2020 was a real shock to the entire global economy. The COVID pandemic brought cities to a standstill: people were dying by the tens of thousands a day, and factories were shutting down. And the markets were in a fever. On March 1, 2020, bitcoin cost $8,600; on March 18, it was already $5,200, but by June 1, it had risen to almost $10,000. (See img. 9, 10)
Today, we're being much calmer about those events and see them as part of history. But at the time there was a real panic around the world – people locked in their homes, terrible forecasts, terrible daily statistics. And there was an even greater panic in the market – money from the crypto market went into more familiar ordinary fiat currencies.
Bitcoin fell by 150 %. And then it almost doubled in three months. That is a huge drop and a sharp rise. At that time, I still understood little about trading. I had just started studying technical analysis, and we were all locked up in self-isolation. It's clear that you always factor in the probability of a price drop into your calculations, but this was an abnormal drop. All the coins we were trading at the time fell by about 50 %, then recovered from the drop and went even higher. The feelings were emphasis – it's sad to wake up and see that your deposit halved overnight.
(Arseniy, 17 years old, five years of experience)
One of the basic principles of technical analysis is that all fundamental reasons for changes in an asset's value are already reflected in its price chart. Therefore, they cannot be considered in the calculations. But just as in physics, there are extreme situations where the usual model does not work. The pandemic turned out to be just such a small black hole – a phenomenon that temporarily disrupted all calculations based on technical analysis. all calculations based on technical analysis.

Img. 9. TradingView. Platform and social network for traders and investors [Electronic resource] – London, England: TradingView UK Ltd., 2024 – Access mode: https://ru.tradingview.com/.

Img. 10. On a long-term chart, the chaos of the pandemic looks like a few red candles, that turn green. But in March 2020, the markets were in a real panic in the markets. TradingView. Platform and social network for traders and investors [Electronic resource] – London, England: TradingView UK Ltd., 2024 – Access mode: https://ru.tradingview.com/.
To assess such risks, traders use fundamental analysis. This works with news, company reports, and market events – things that are difficult to fit into a mathematical model. The purpose of fundamental analysis is to determine the fair price of an asset and its deviation from the market. The trader assumes that the market price will eventually equal the fair price, and the deviation indicates which position is better to open. For example, a pandemic and the general closing of businesses means a sharp increase in the likelihood of an economic crisis. This in turn leads to an outflow of funds into less risky assets, i.e., to decrease in the capitalization of the entire cryptocurrency market.
The problem with fundamental analysis is that the market's reaction to the news does not always correspond to the experts' assumptions; i.e., it is unpredictable. For example, in fundamental analysis, gold is considered a countercyclical commodity. This means that the price of gold should rise when the markets are generally falling, and drop when the markets are generally rising.
But March 2020 was a fantastic month in which fortunes were made and lost. Our trader, Viktor, was trading gold futures at the time because it seemed to be the most stable and reliable asset. And yet, there are situations when even an experienced trader loses money.
Over the previous six to eight months, I made 51–52 thousand dollars from trading gold. It was a stable income – everything was going well. But on March 9, 2020 (I will never forget this day), Saudi Arabia announced its desire to increase oil production and reduce its cost – the actual rupture of the OPEC+ deal. On the back of this news, oil dropped almost 30 %, gold rose 1.6 %, and I lost 70 % of my trading capital in five minutes.
I had a stop-loss in the terminal – everything was as it should be. But the flow of orders pouring into the market was such that my stop loss was triggered at 700 points. To me, that was nonsense. I closed the position manually and recorded the loss. That day, in five minutes I lost $44.5 thousand that I had earned for over six months.
(Viktor, 31 years old, nine years of experience)
Arseniy lost much less than Viktor in absolute numbers, but he was only 14 years old at the time. It was a tough test that I tried to help him pass.
Trading requires a lot of mental energy, and a trader is always balancing between a feeling of worthlessness and omnipotence. The market usually punishes arrogance quickly, but in difficult times you'll need support from one of your colleagues or loved ones.
This is another advantage of the dealing center – when you see that everyone is losing money, you understand it's not about you. And if one of your colleagues manages to make money despite the general panic, you can learn from him on the spot – what did he notice that the others did not? When you trade alone, you have to carry this burden yourself.
A month later, the price level was restored. When bitcoin returned to its entry point of around 7000 and rose by another 50 %, I even made a profit. This was already at the end of May. The lockdown ended, we were all released, and we went on vacation to Greece, where we spent two months. And finally, I got out of the position. But being in such a constant state of uncertainty is not always the most pleasant feeling.
(Arseniy, 17 years old, five years of experience)
Training with M helped Arseniy develop another useful skill: looking for the reasons behind what is happening. Since the reasons were fundamental in this case, the further direction of study became clear – fundamental analysis and Elliott wave theory.
3. Trading. Technical Analysis
Despite the fact that technicians and fundamentalists are often at odds with one another, there are ways they can work together for mutual benefit. Market analysis can be approached from either direction. While I believe that technical factors do lead the known fundamentals, I also believe that any important market move must be caused by underlying fundamental factors. Therefore, it simply makes sense for a technician to have some awareness of the fundamental condition of a market.
John J. “Murphy. Technical Analysis of the Financial Markets”
Elliott wave theory was taught to Arseniy by K, who understood it very well and constantly applied it in practice. moreover, K was from Greece, where we were at the time. The strength of the wave theory is its applicability over different periods, from one hour to tens of years; the wave principle is universal.
Ralph Nelson Elliott discovered that price charts in rising and falling markets form similar cycles. There are always five primary waves – three impulse waves and two corrective or retracement waves in between. Then there are three more, labeled A, B, and C, which complete the cycle. In a rising market, impulse waves (first, third, and fifth) are directed upwards, and retracement waves (second and fourth) are directed downwards. On a downward trend, on the contrary, impulse ones go down, and retracement ones go up. (See img. 11)
Elliott discovered that price targets for each predicted wave could be calculated using Fibonacci ratios. for example, the height of wave three should be approximately 1.618 times the height of wave one, and wave four should represent a correction of 38.2 % or 50 % of the height of wave three, etc. waves three and five are the most important in terms of trading opportunities. The first one is usually the most powerful, and the top of the second one indicates the need to change open positions to the opposite ones. Candlestick signals help to confirm the reaching of the end point of a particular wave.
Neeson Steve. “Japanese candlesticks. Graphical analysis of financial markets”
Psychologically, each wave represents a change in market sentiment, the entry or exit of certain groups of investors. The first wave is the beginning of a trend when, for some reason, a great number of traders have decided that the price would go up. For example, it could be good news about an asset. (See img. 12, 13)
At some point, some investors start to record profits and get out of the asset – the price goes down. But if the overall market sentiment is truly bullish, the second wave does not reach its minimum, fizzles out, and the chart reverses.
Two types of investors make up the third wave. First, they were late for the first wave – during the second one, they waited for the price to drop again before entering the market. And second, these are most traders – they saw an emerging pattern and a profitable opportunity. The general trend is gaining strength and accelerating.
The fourth wave is usually weaker than the second as fewer people want to take profits than are trying to get into the asset on time. The price reverses again, and the highest wave begins – the fifth one. At this point, knowledge of the laws of the market begins to take effect – experienced traders understand that the growth will end soon and wait for a good moment to take profits. Beginners see a third consecutive increase in the exchange rate and continue to buy, pushing the price up. When they are exhausted, the primary cycle is complete.
The last three waves indicate the market has returned to relative calm. Traders record profits or losses; the rate is fixed at a new level.
Technical analysis is more of an art than a science; it has guidelines but no strict rules, so there may need to be clear definitions.
Neeson Steve. “Japanese candlesticks. Graphical analysis of financial markets”

Img. 11. Wave theory has many practical implications. For example, it states that even in a bull market. there will be growth phases, and in a bear market – falls, after which the main trend will continue. The waves themselves obey certain mathematical rules, i.e. it is possible to calculate local minimums and maximums of quotes. TradingView. Platform and social network for traders and investors [Electronic resource] – London, England: TradingView UK Ltd., 2024 – Access mode: https://ru.tradingview.com/.

Img. 12. TradingView. Platform and social network for traders and investors [Electronic resource] – London, England: TradingView UK Ltd., 2024 – Access mode: https://ru.tradingview.com/.

Img. 13. TradingView. Platform and social network for traders and investors [Electronic resource] – London, England: TradingView UK Ltd., 2024 – Access mode: https://ru.tradingview.com/.
The main problem with Elliott's theory is that the waves are less obvious on actual charts than they are in textbooks. First, these are not usually straight, clear lines but saws – continuous small fluctuations. It means that the trader must decide each time whether the following price fluctuation means the end of the wave or not. Instead of explicit rules, independent decision-making means subjectivity – every trader can read the same chart differently.
Fundamental aspects can also affect this: the release of financial reports, macroeconomic data, and increased political risks. For example, a semi-annual impulse or pullback wave can shift the daily waves in the direction of its movement. Then it looks on the chart either as a resonance – the daily wave is strengthened by the annual wave – or as a cancellation – it is weakened. Uncertainty is added by the younger cycles and also by fundamental aspects such as the release of financial reports, macroeconomic data, and increased political risks. As a result, the waves begin to overlap each other and create a very confusing picture. You need high qualifications and many additional tools to understand it – this is not for beginners. (See img. 14, 15)
Third, the trader must act before the cycle is fully drawn, as it will be too late to open a position. This means that they will have to predict further movement based on the beginning, the first waves, which in the end may turn out to be a false signal.
The problem with technical analysis is its complexity. If you understand it deeply, you must use many indicators, moving averages, and wave analysis – these tools often send conflicting signals. But if you simplify the theory, another problem arises: indicators rarely work consistently; for some reason they can perform well for two or three weeks and then poorly for two or three months. You start to think that it's not working, you switch to another one, and the whole thing repeats itself.
(Nikolai, 30 years old, eight years of experience)
Studying with K showed that any grand theory could be too complex. At the same time, its unsystematic simplification for speed leads to errors. The way out is to tune yourself and choose a set of tools that would best fit your mentality.

Img. 14. TradingView. Platform and social network for traders and investors [Electronic resource] – London, England: TradingView UK Ltd., 2024 – Access mode: https://ru.tradingview.com/.

Img. 15. The ETH exchange rate was collapsing, but at some point it stopped and started to rise sharply. There are two reasons for this technical and fundamental. Firstly, the support level worked, and secondly, there was an analytical report that stated that ETH should be worth more than 2000 dollars. The result was a trend change. TradingView. Platform and social network for traders and investors [Electronic resource] – London, England: TradingView UK Ltd., 2024 – Access mode: https://ru.tradingview.com/.
At some point, the K's approach seemed abstract to me. I had already gained some experience and understood that abstraction trading is not just about knowing the five waves; other factors should be considered. But I got what I needed from K. For example, if a certain trend repeats itself over and over again, you can pick up the movement in the 'crossover5' on the third wave.The third wave will be long; and a 'local breakout' may occur. The fourth wave is a correction; the fifth wave can make another move, a local breakout from the level. And then, after the fifth wave, we no longer pursue a level breakout – a three-wave pattern of A, B, and C begins. This is a more prolonged correction. And I have found that there is no point in counting on any further movement after the fifth wave.
(Arseniy, 17 years old, five years of experience)
Every career leaves an imprint on a person's worldview. A consequence of my 17 years of teaching is that I see education as an integral system, a methodology with a precise result. Knowledge can come in any form, including games. However, it is important to extract the key points from it and test them, draw a line, or conduct some kind of exam – at least for yourself. And the best test is practice.
If you fail to apply the acquired knowledge, at first it will seem disconnected from life and will be forgotten completely. At this stage of his training, Arseniy received a lot of useful but theoretical information about Elliott's waves. He focused only on what he could apply immediately in trading. But it was only a few years later, in Spain, when practice caught up with theory, that I truly appreciated this instrument.
Many trading coaches say that you need to find eight of your own factors, which you should consider in your further work – see them as a signal to open or close a position. But, as practice shows, eight is too many; it is rarely possible to wait for the moment when they are all pointing in the same direction and make a timely trading decision. Therefore, more experienced traders limit themselves to five – when all five factors predict the exact price movement, they can open a position. This is a minimum number – even four unidirectional factors are considered too risky.
The observation that comes with experience helps a trader to assess the situation in the market quickly and correctly. The brain picks out familiar pictures and immediately suggests a solution.
All methods of technical analysis overlap and complement each other to some extent. On the day when a trader sees the relationship between these methods and can mentally imagine technical analysis as a single whole consisting of a set of techniques and approaches, they can earn the honorary title of a technical analyst.
John J. “Murphy. Technical Analysis of the Futures Markets: A Comprehensive Guide to Trading Methods and Applications”
The same is true for chess players: theory explains in detail which factors are essential for victory or defeat and how to recognize them. However, a grandmaster only needs one glance at the chessboard to understand which opponents are winning. An experienced trader can spend a long time explaining to a novice what they saw on the chart and why they decided to open a position. He recognized a familiar picture and acted almost automatically.
At some point, your experience, everything you have done in the market before, your entire background comes into play. I often open a position when I cannot find five or six factors and explain why I took it. I see – the picture is perfect. My experience tells me that the pattern looks promising, and the candlesticks are moving correctly. It will not be possible to explain this to beginners – they will not understand it or be able to use it because they lack experience. And I can already see when the candle 'twitches long', that the rate will increase.
(Arseniy, 17 years old, five years of experience)
The work of a trader requires analyzing many factors and at the same time, quick decision-making, which is quite difficult to combine. Fortunately, our brains have evolved to conserve our mental resources. We draw some conclusions automatically, based on previous experience, and therefore spend less time and effort on solving familiar problems. Choose the most convenient trading system and your trading rhythm to keep up with everything.
Around this stage of training and work, the mechanisms of the psyche begin to come to the fore. For example, success becomes a significant motivator for continued learning and a reason to keep up. A novice trader enjoys their victories when they clearly understand that they have earned the result through hard work. Indeed, these are the first fruits not of blind luck but of invested effort and resources. Isn't it a dream to have an exciting job that also pays well?
But in trading, as in sports, success is never permanent. There will always be failures. Sometimes they are unbiased: for example, when the market has received an unexpected external stimulus. Then it is a blow to the wallet, but not to the ego. But there will also be obvious mistakes when there is no one to blame, and at such times psychological stability is extremely important.
I like trading. I enjoy it. I feel like I belong here. When you look at your past trades, you understand that you opened a position because you analyzed everything yourself. You understood it yourself; you didn't hear it from someone, you didn't read it somewhere, you saw it, decided to go in, and took your profit. I get a kick out of it.I believed in myself, went in, did everything, and came out with a profit. I like it, even the negative trades. Yes, while losses are complex, I immediately look at why my losses are adverse. I recognize that this is is often my mistake – I get in early and find a bad entry point, for example. But I know how it works and I don't want to go anywhere else.
(Igor, 23 years old, less than one year of experience)
It's important to note that Igor talks calmly about his mistakes because he gets timely help from his colleagues at the dealing center. Even an experienced trader can find it challenging to analyze the market and monitor his psychological state simultaneously, even more so for a beginner. In addition, normal fatigue takes its toll. every trading decision is like approaching a piece of sports equipment – it consumes energy. But while fatigue that accumulates in the gym is only physical, you also gradually lose your willpower during a challenging trading session. Mental fatigue can lead to behavioral changes – unreasonable fear and shock reactions that make profitable trading impossible.
The free excerpt has ended.